
HYPROP
Soil Moisture Release Curves
local base price
Automated calculation of high-resolution soil moisture release curves and unsaturated hydraulic conductivity—in just days, instead of months.
- Soil moisture release curves in days, not months
- Curves with hundreds of points
- Delivers an ASTM-compliant method for determining soil water characteristic curves
-
Overview / Features
-
The trouble with moisture release curves
Creating soil moisture release curves has always been tricky. Traditional methods require a ton of work, are limited by a lack of data points, and can take several months just to complete a partial curve. And there’s never been an easy way to measure the range of soil water potential for an entire curve. Until HYPROP.
Simply accurate. Simply fast. Simply automated.
As soil scientists who have made hundreds of soil moisture release curves, we wanted an instrument that delivered greater accuracy. And we demanded an instrument that was automated. The HYPROP takes only days vs. months to generate a soil water characteristic curve in the wet range, and it does this automatically.
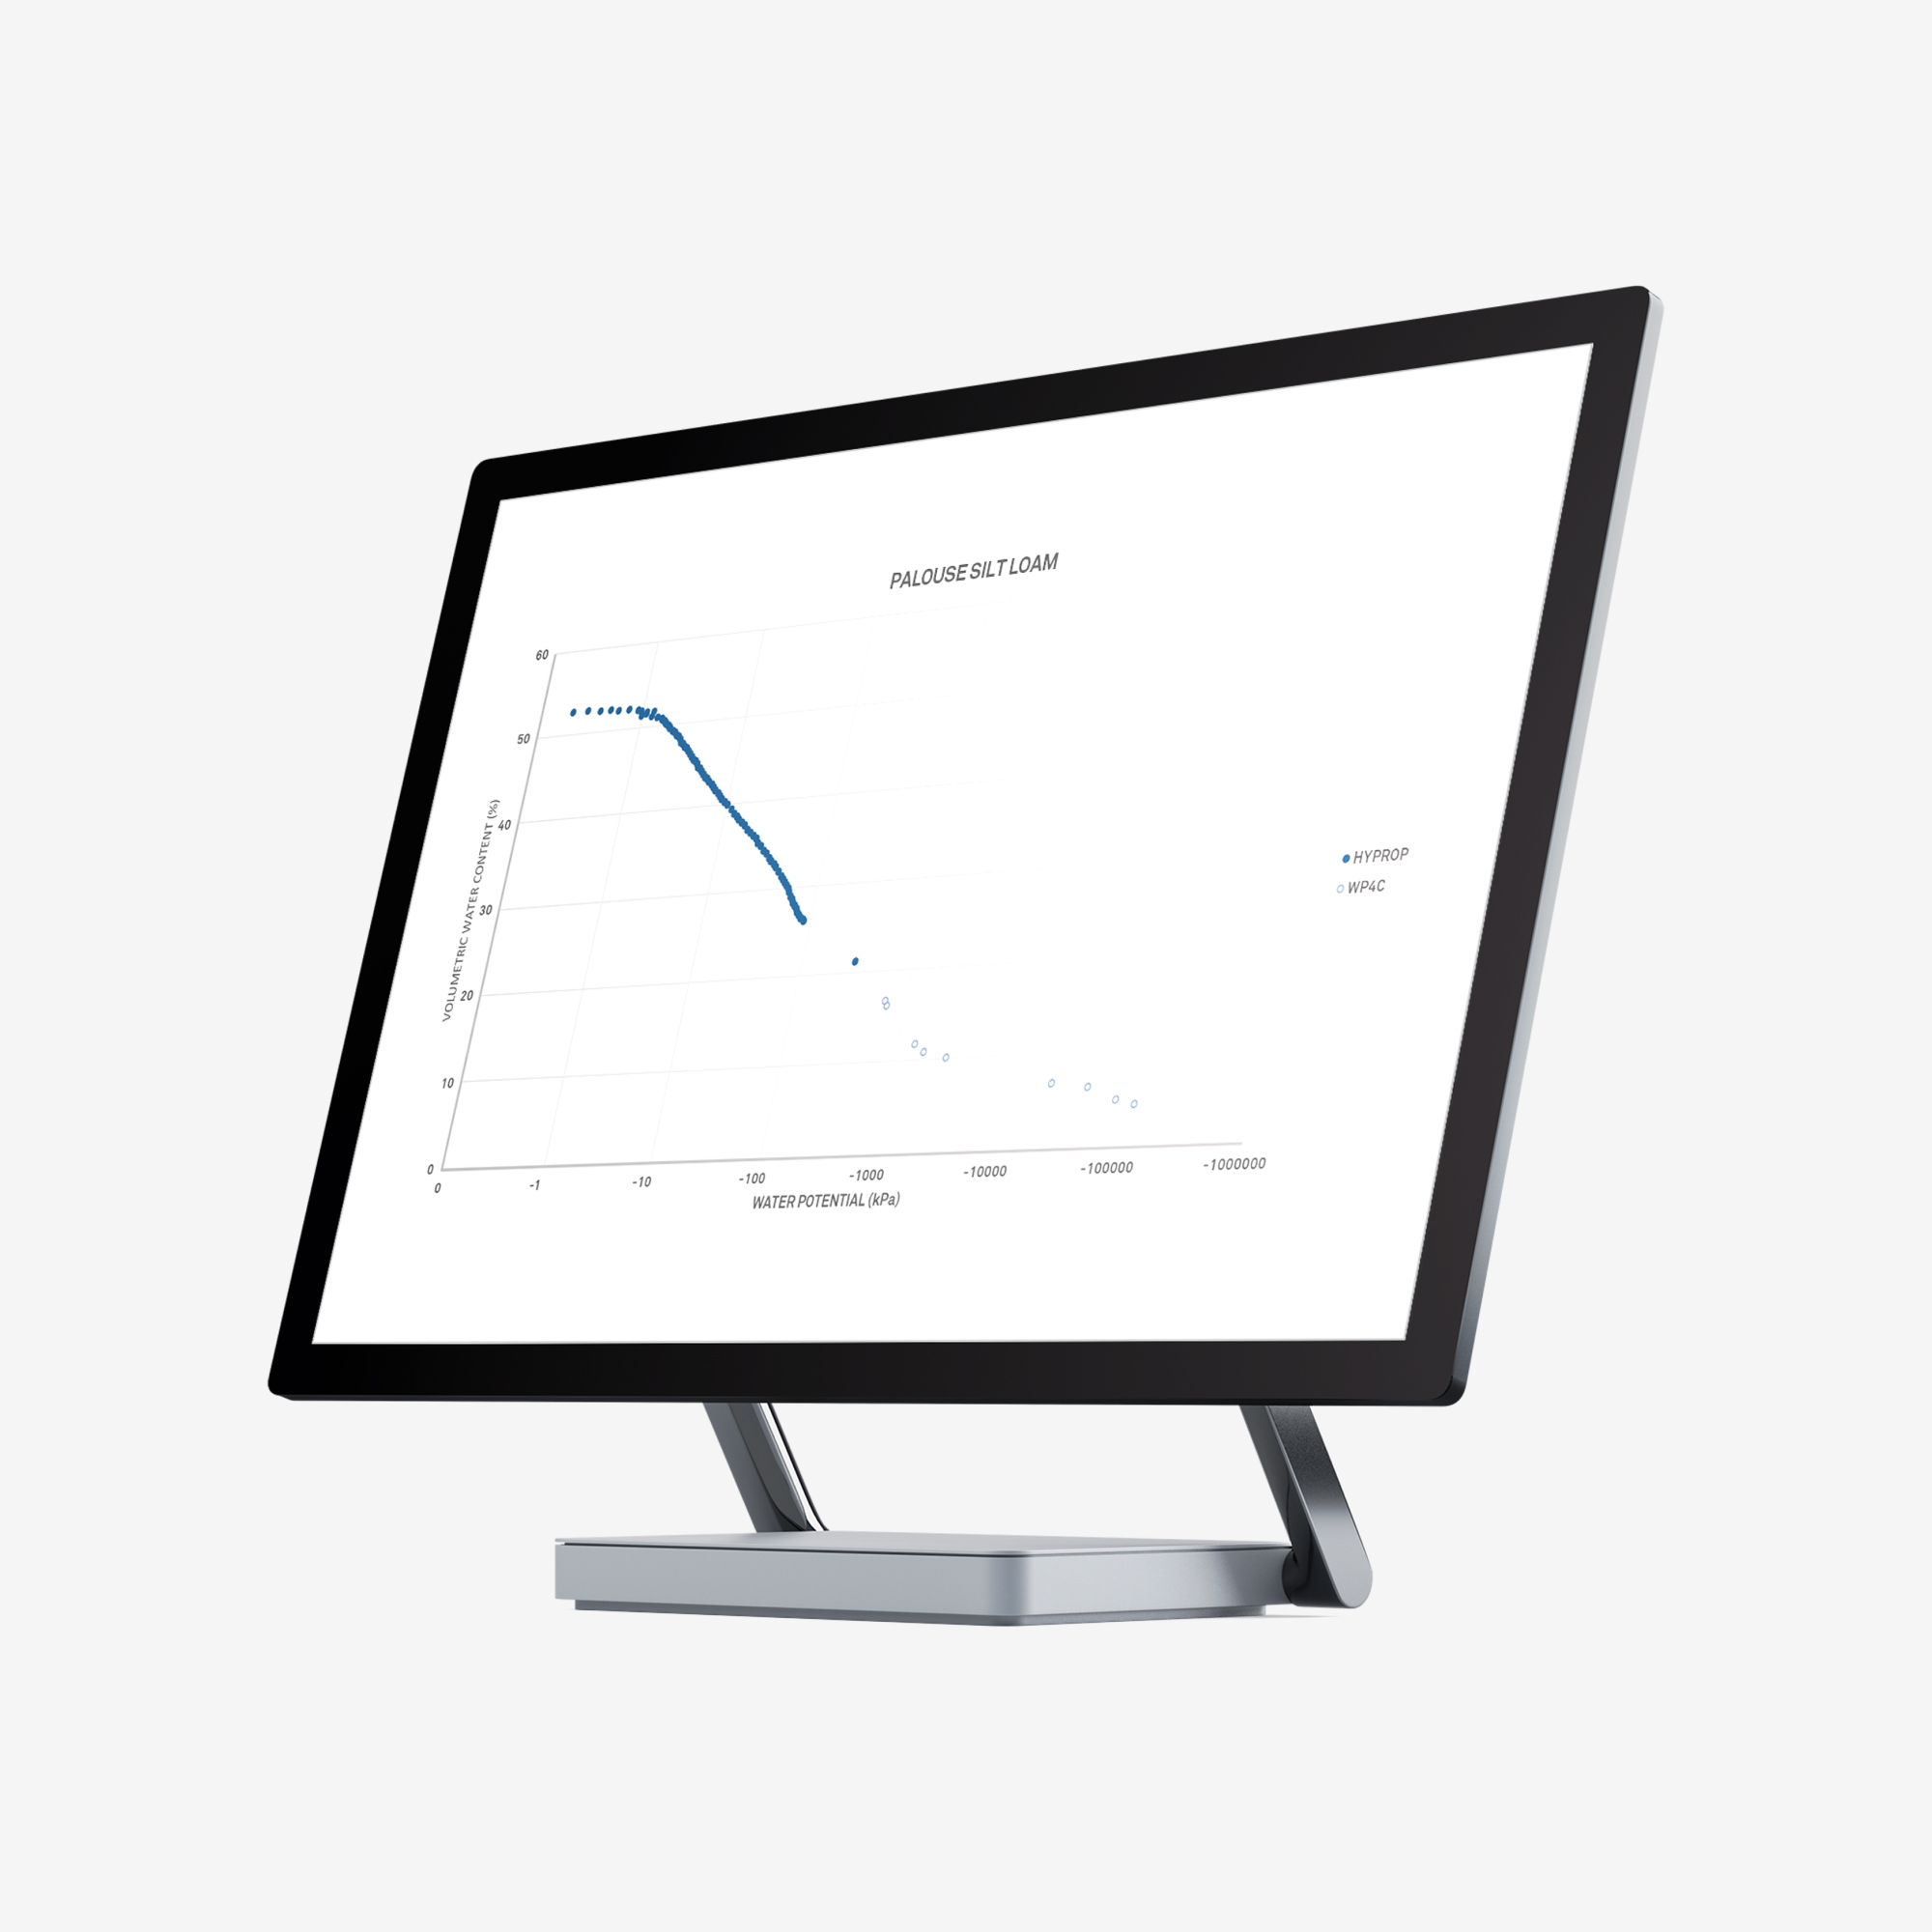
Use the HYPROP together with the WP4C (which measures the dry range), and you can create full, high-resolution moisture release curves across the entire range of soil moisture. Nothing else is capable of doing that—not at this level of detail.
Ready for your next project, compliant with international standards
Compliant with ASTM standard D6836-25, the HYPROP delivers a high-resolution soil water characteristic curve suitable for hydrological characterization of unsaturated soils and characterizing the shear strength and compressibility of unsaturated soils. Combine the automation and accuracy of the HYPROP to get the data your project needs quickly and easily.
Sampling ring flexibility
On top of all that, we designed the HYPROP to automatically determine unsaturated hydraulic conductivity on undisturbed soil samples placed inside a standard 250 mL or 100 mL, 2 in diameter sampling ring. Used in tandem with the KSAT, it can generate a hydraulic conductivity curve for any soil type. The resulting instrument winds up saving you time, hassle and worry.
Unparalleled accuracy
When it comes to soil water potential, measurements don’t get any more accurate or precise. That’s because the HYPROP produces more data points (over 100 data points in the 0 to –100 kPa range), higher resolution data, more detail, and better information in its moisture release curves—information that is missed when using the traditional pressure plates or hanging water column methods.
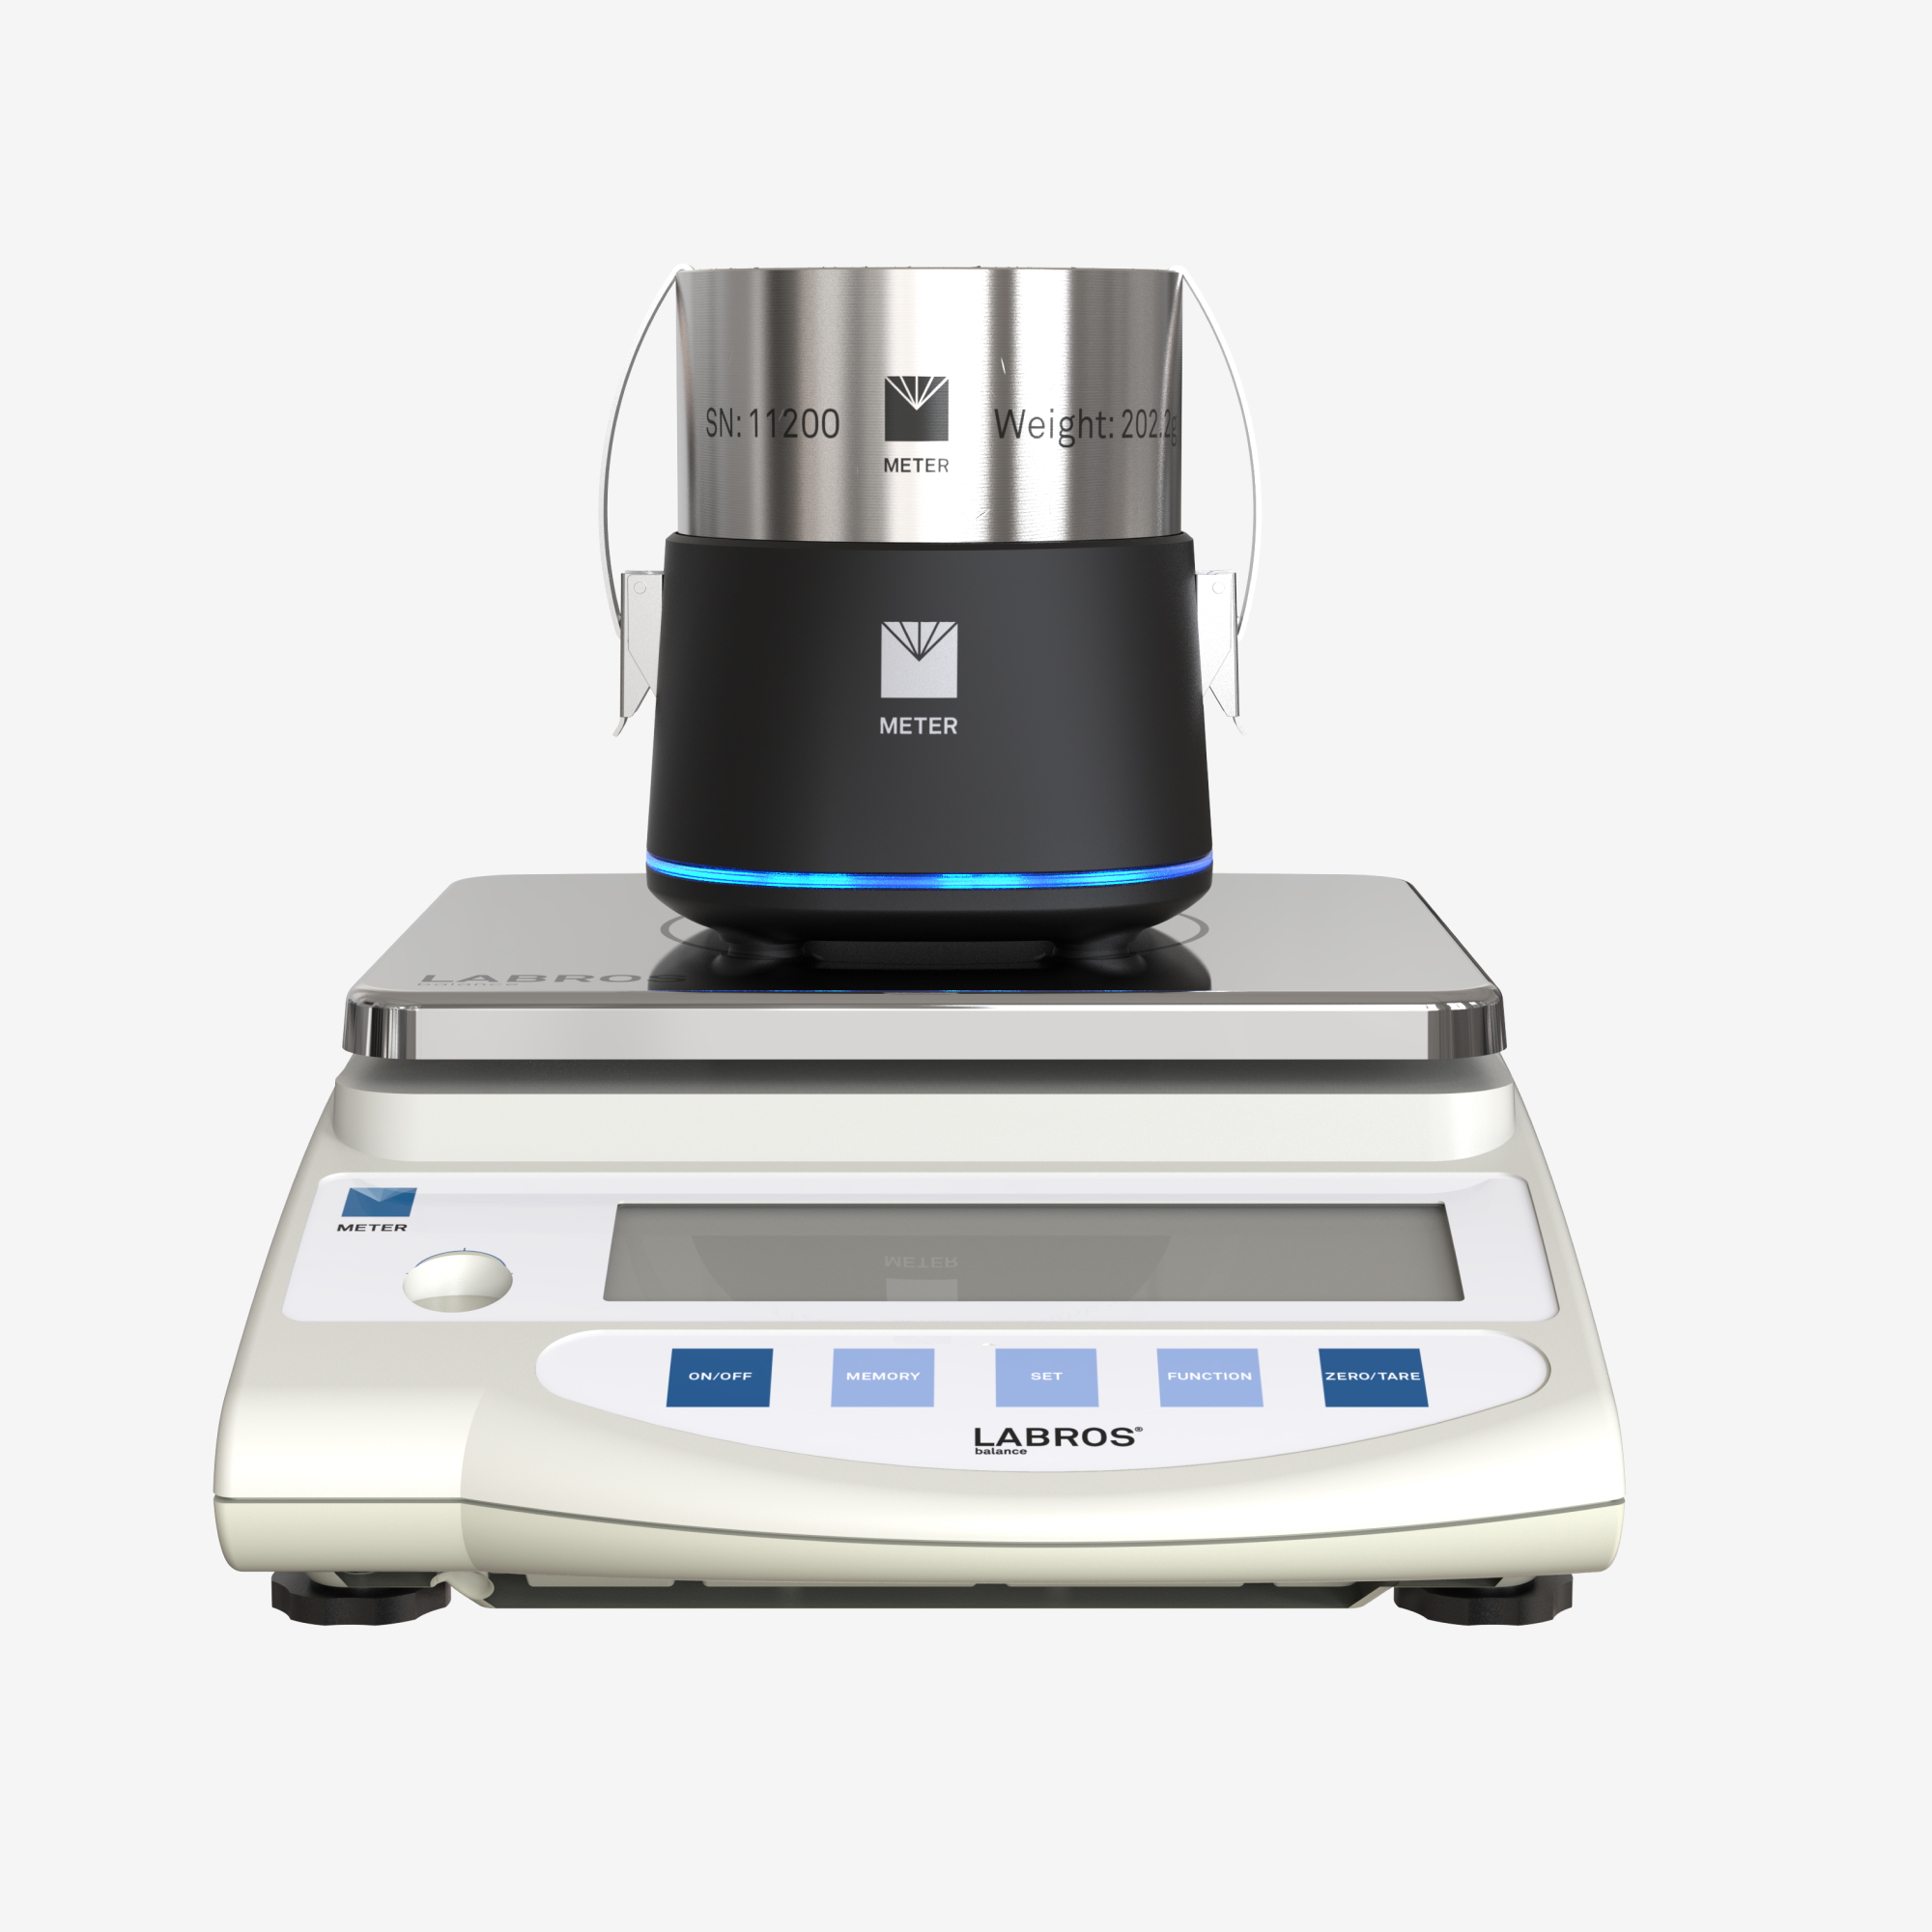
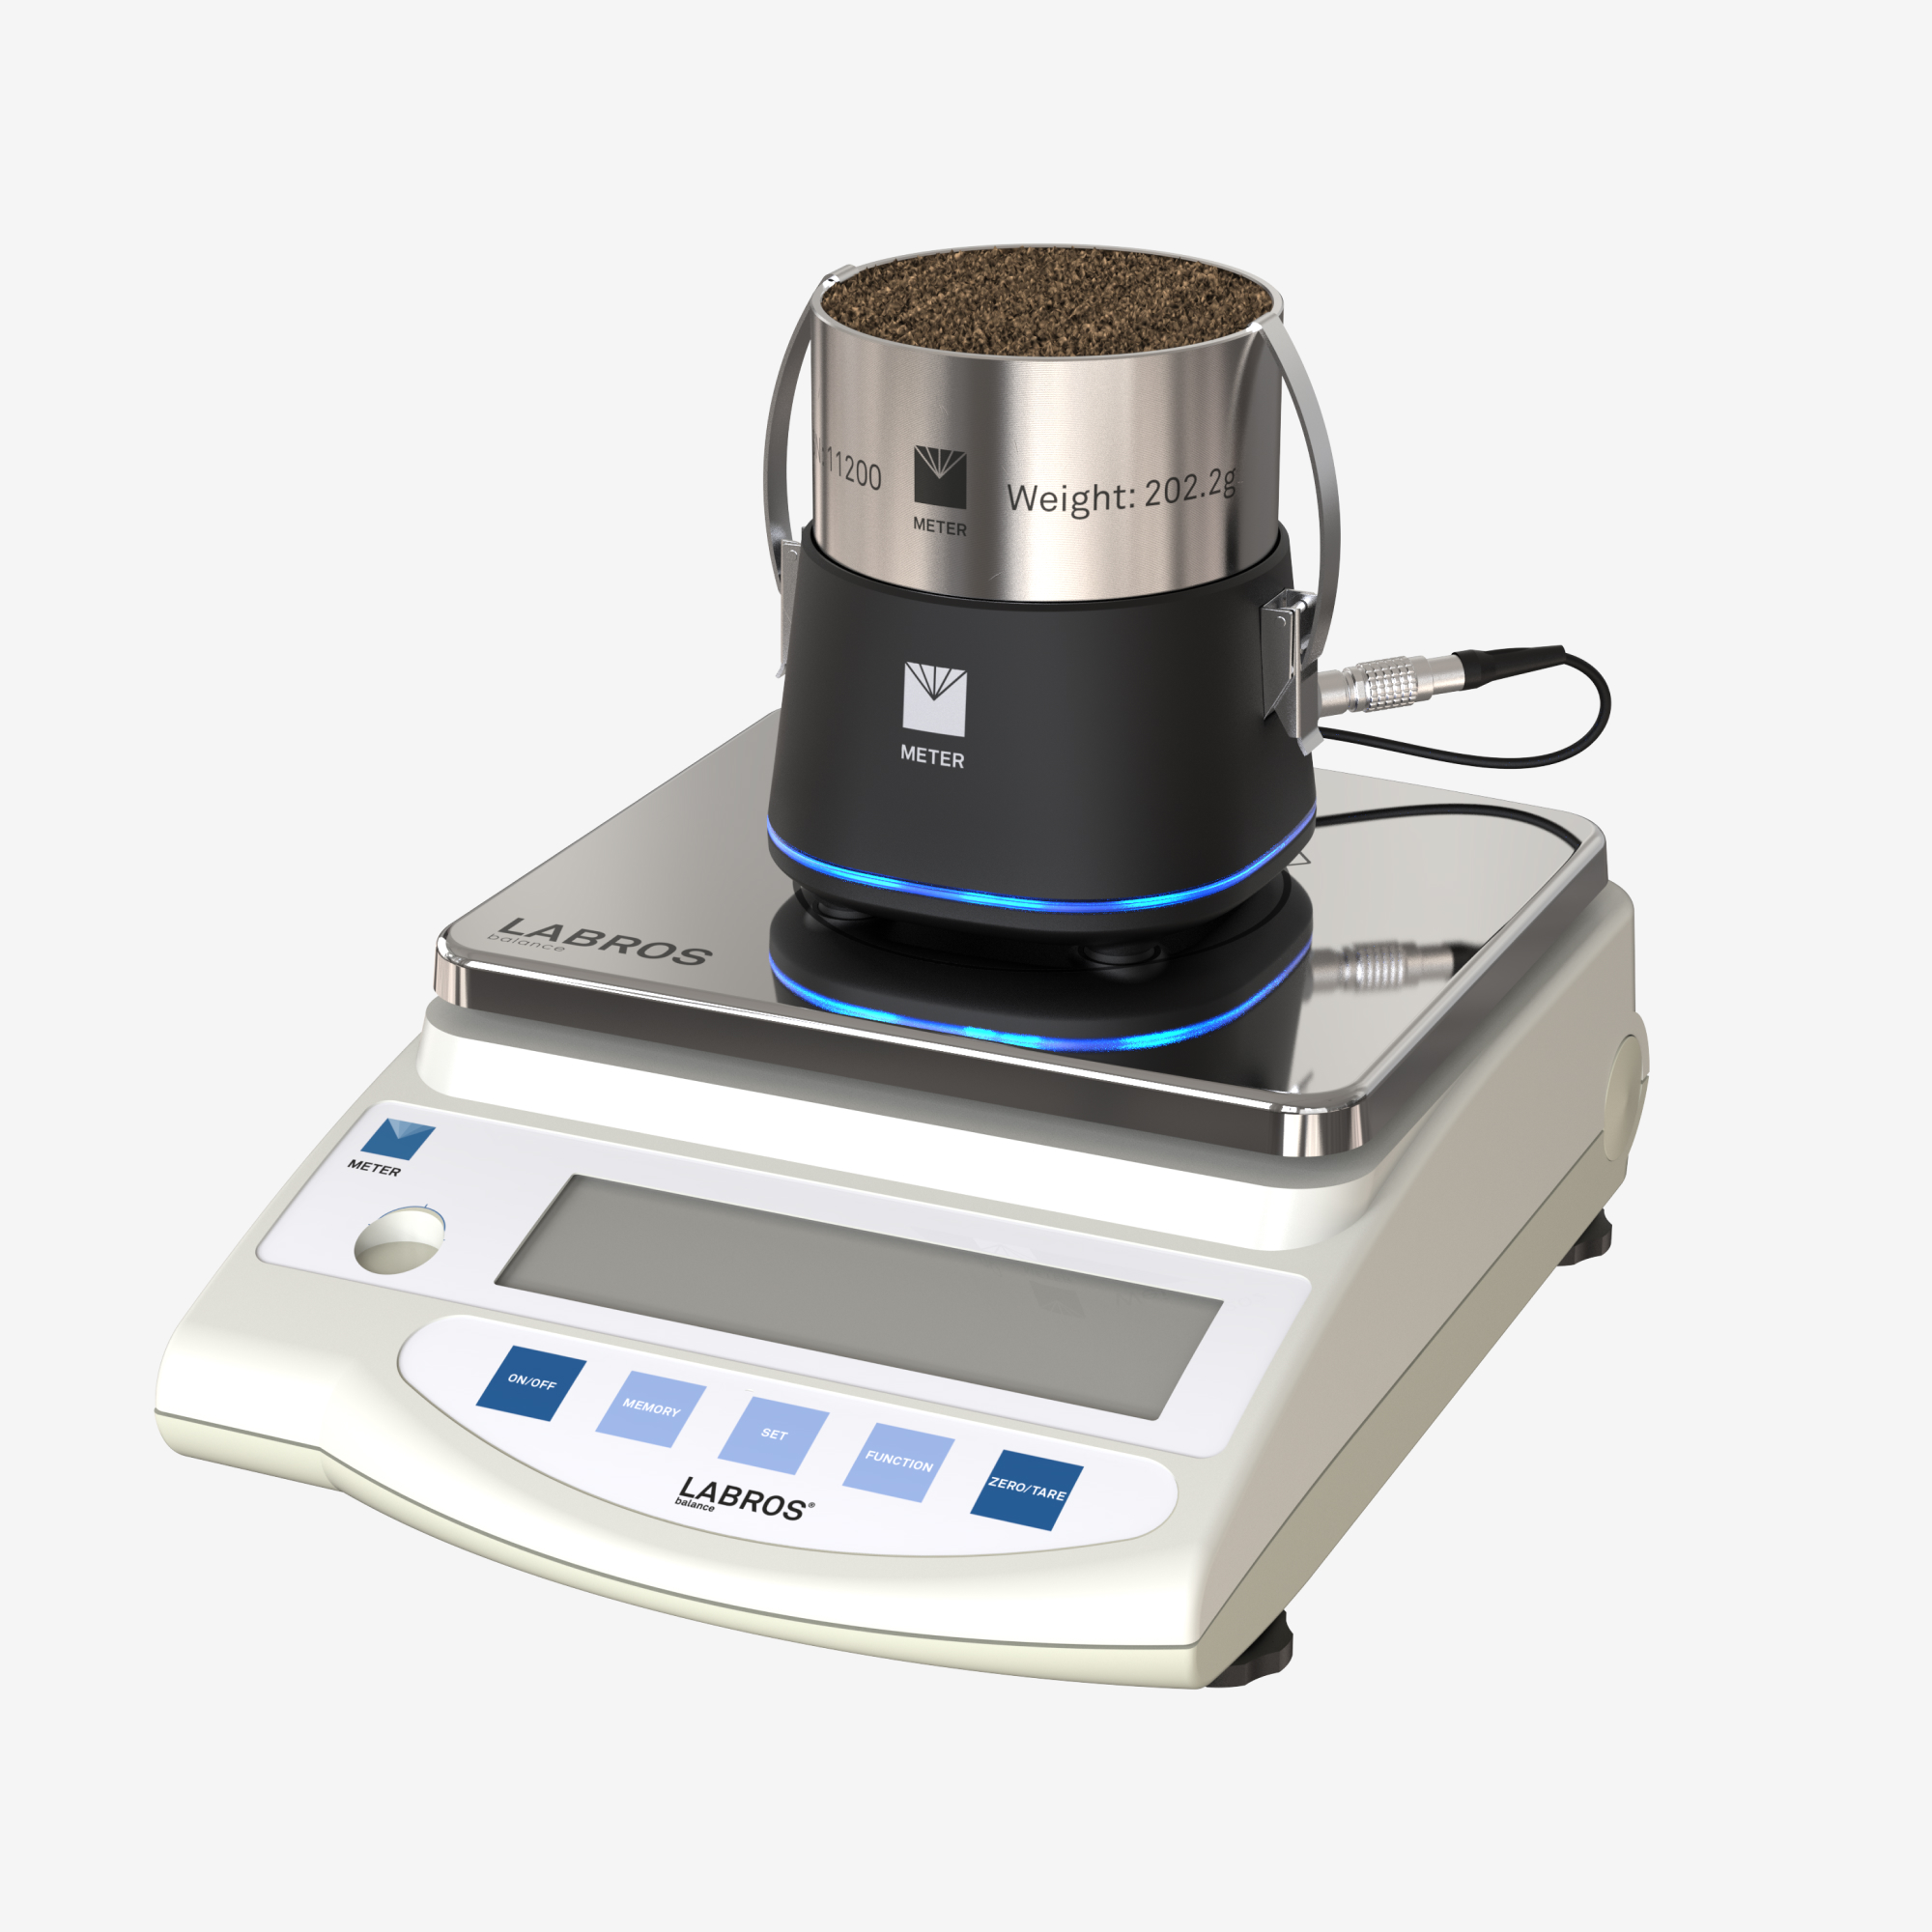
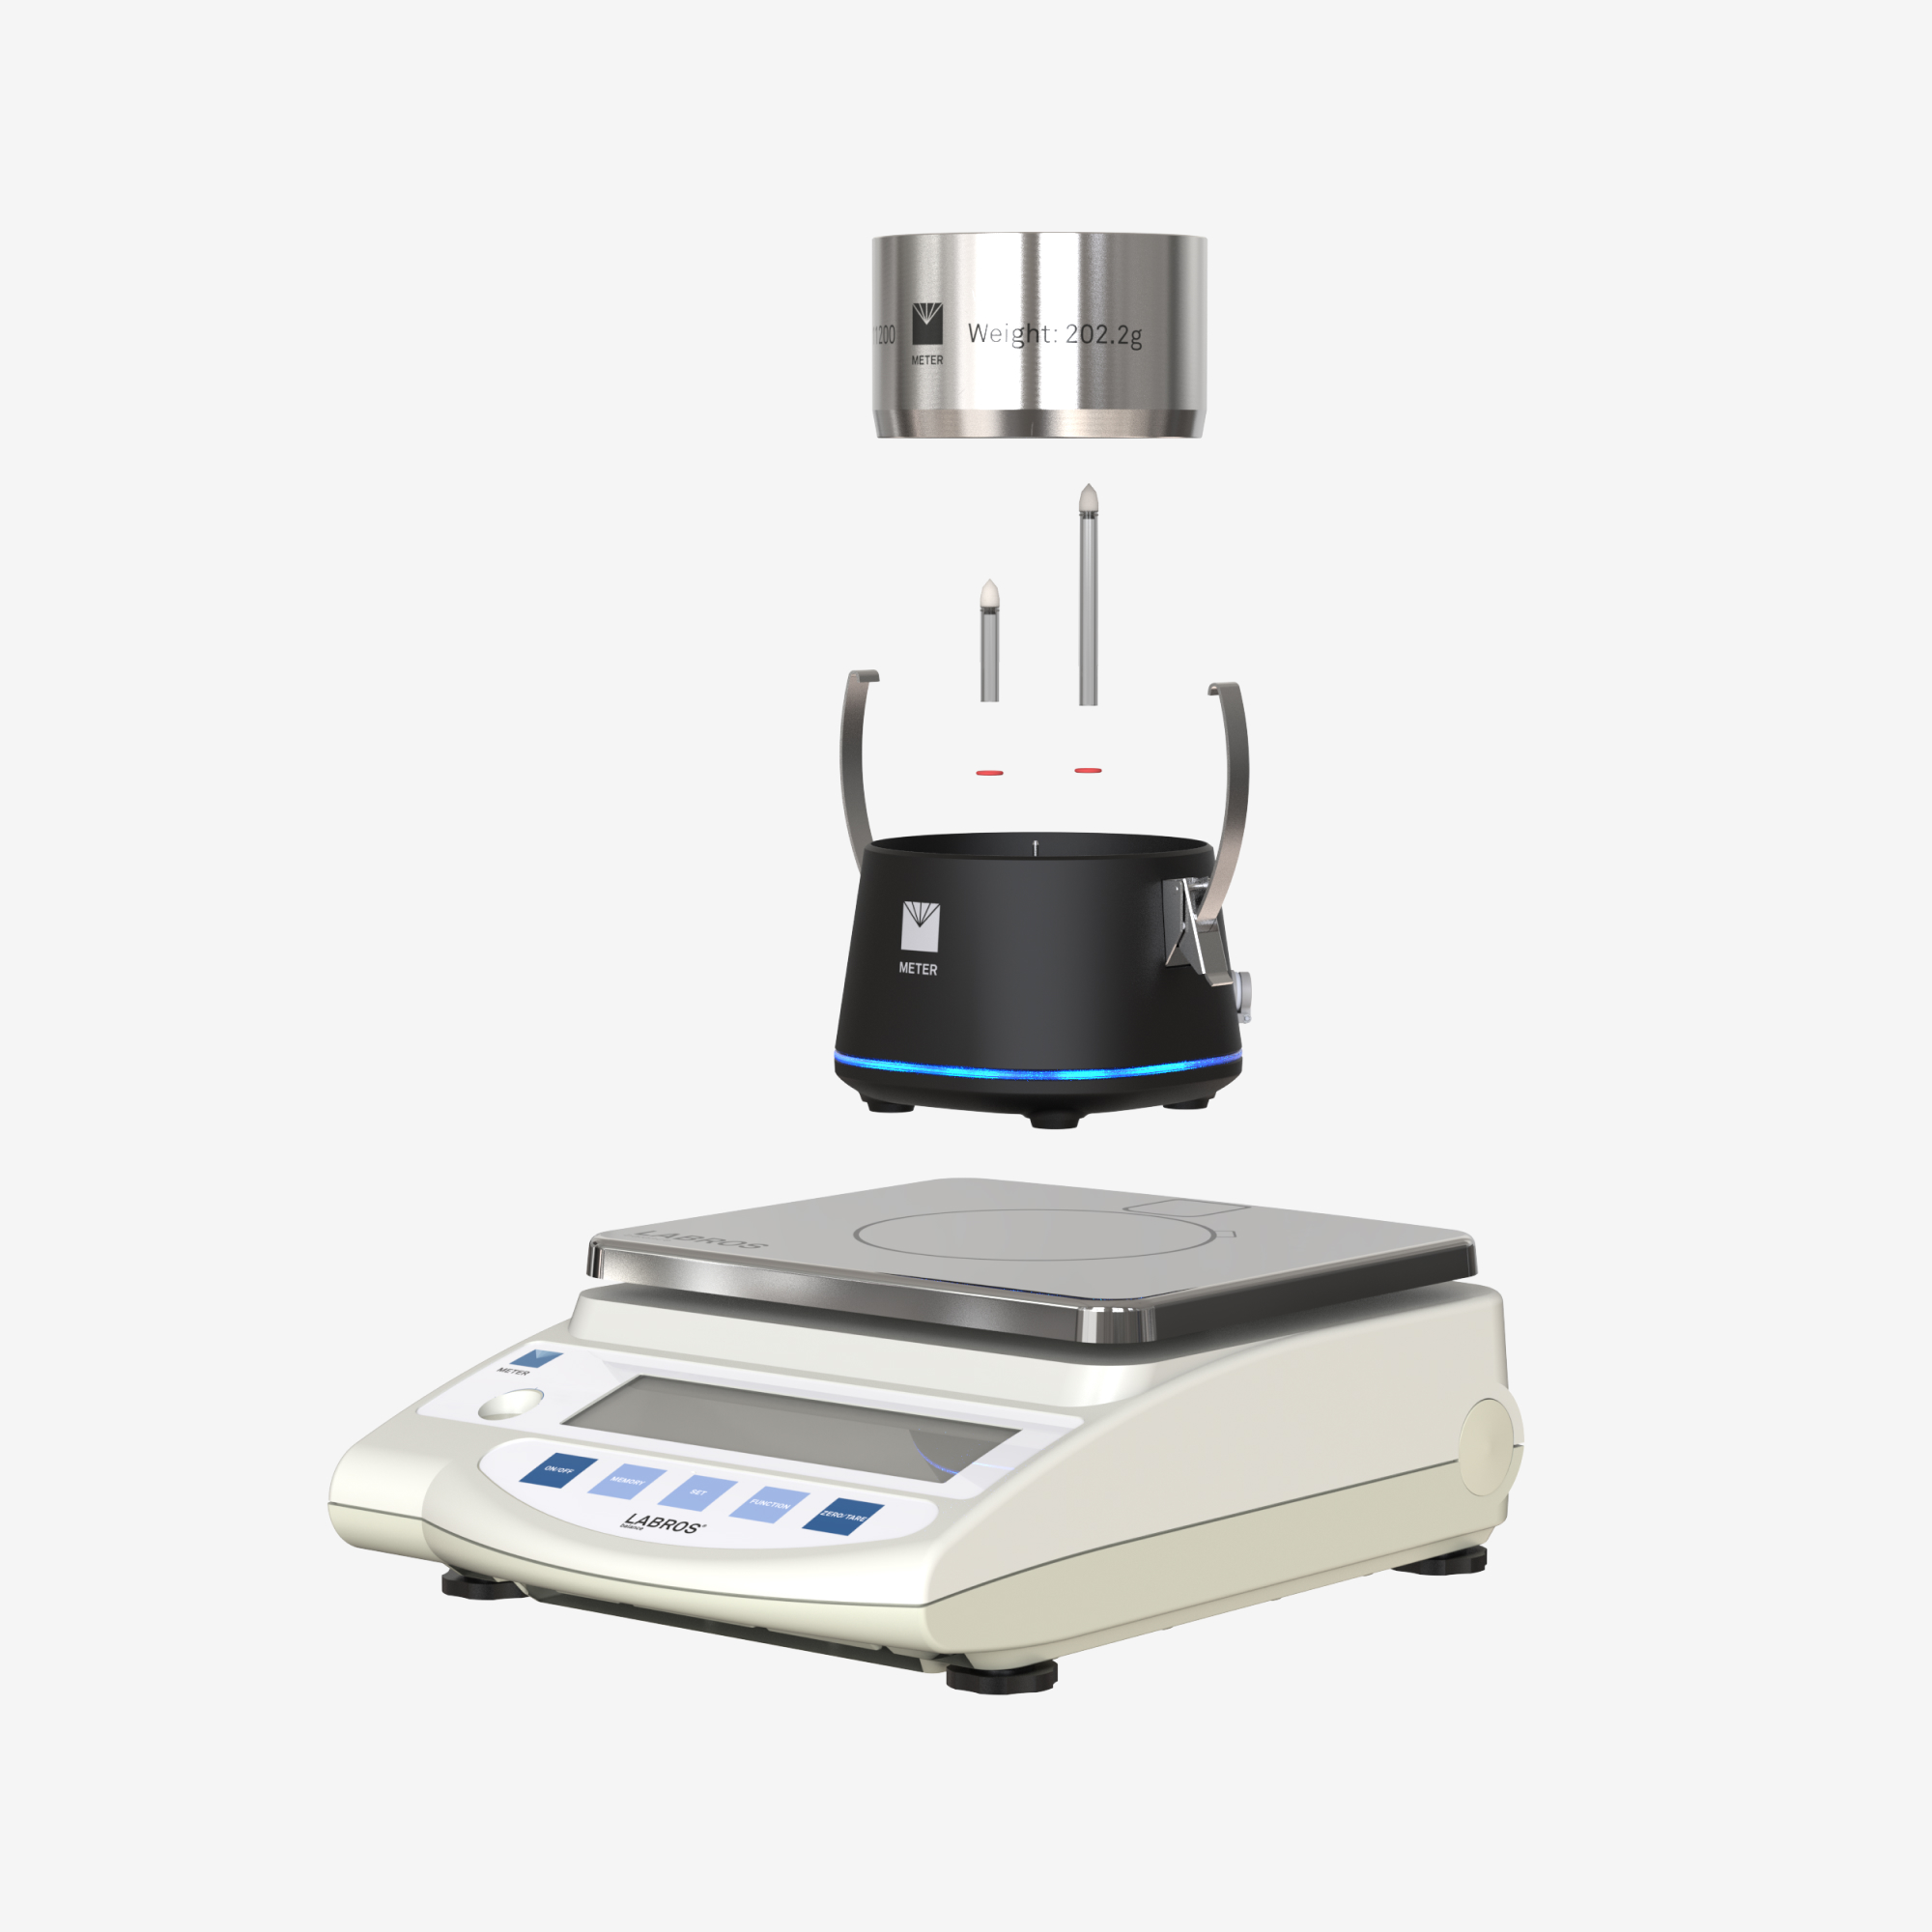
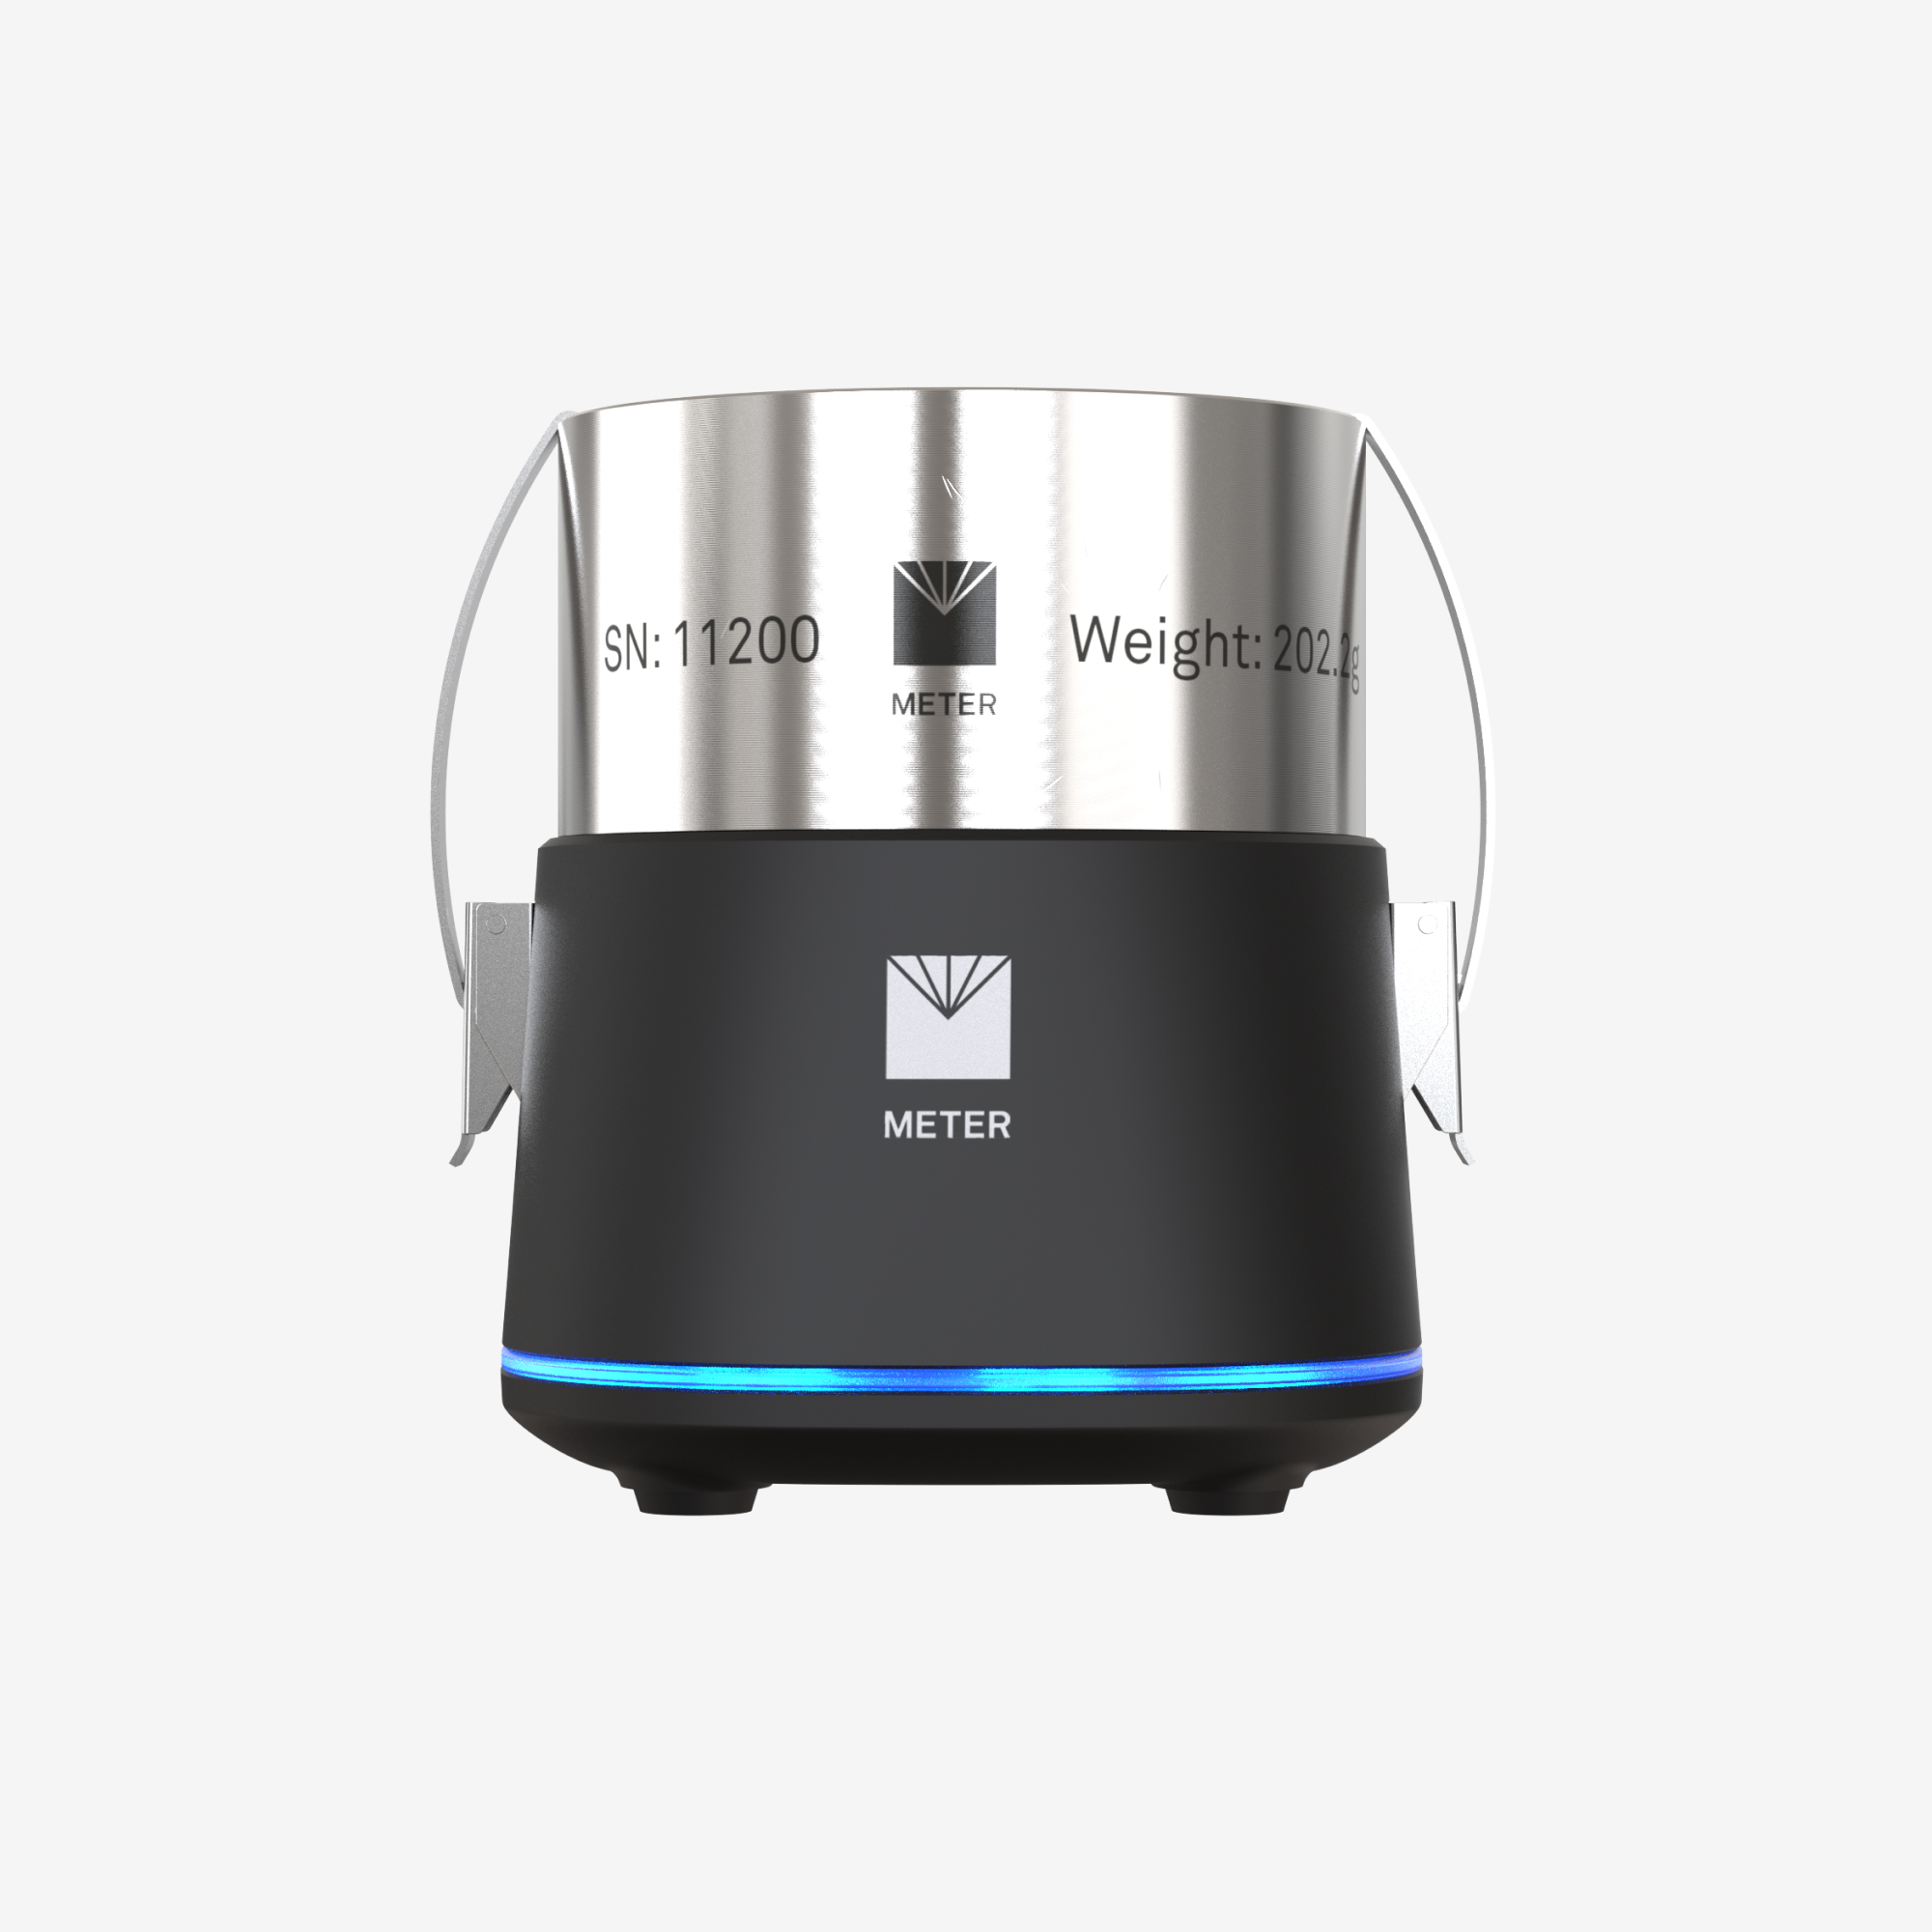
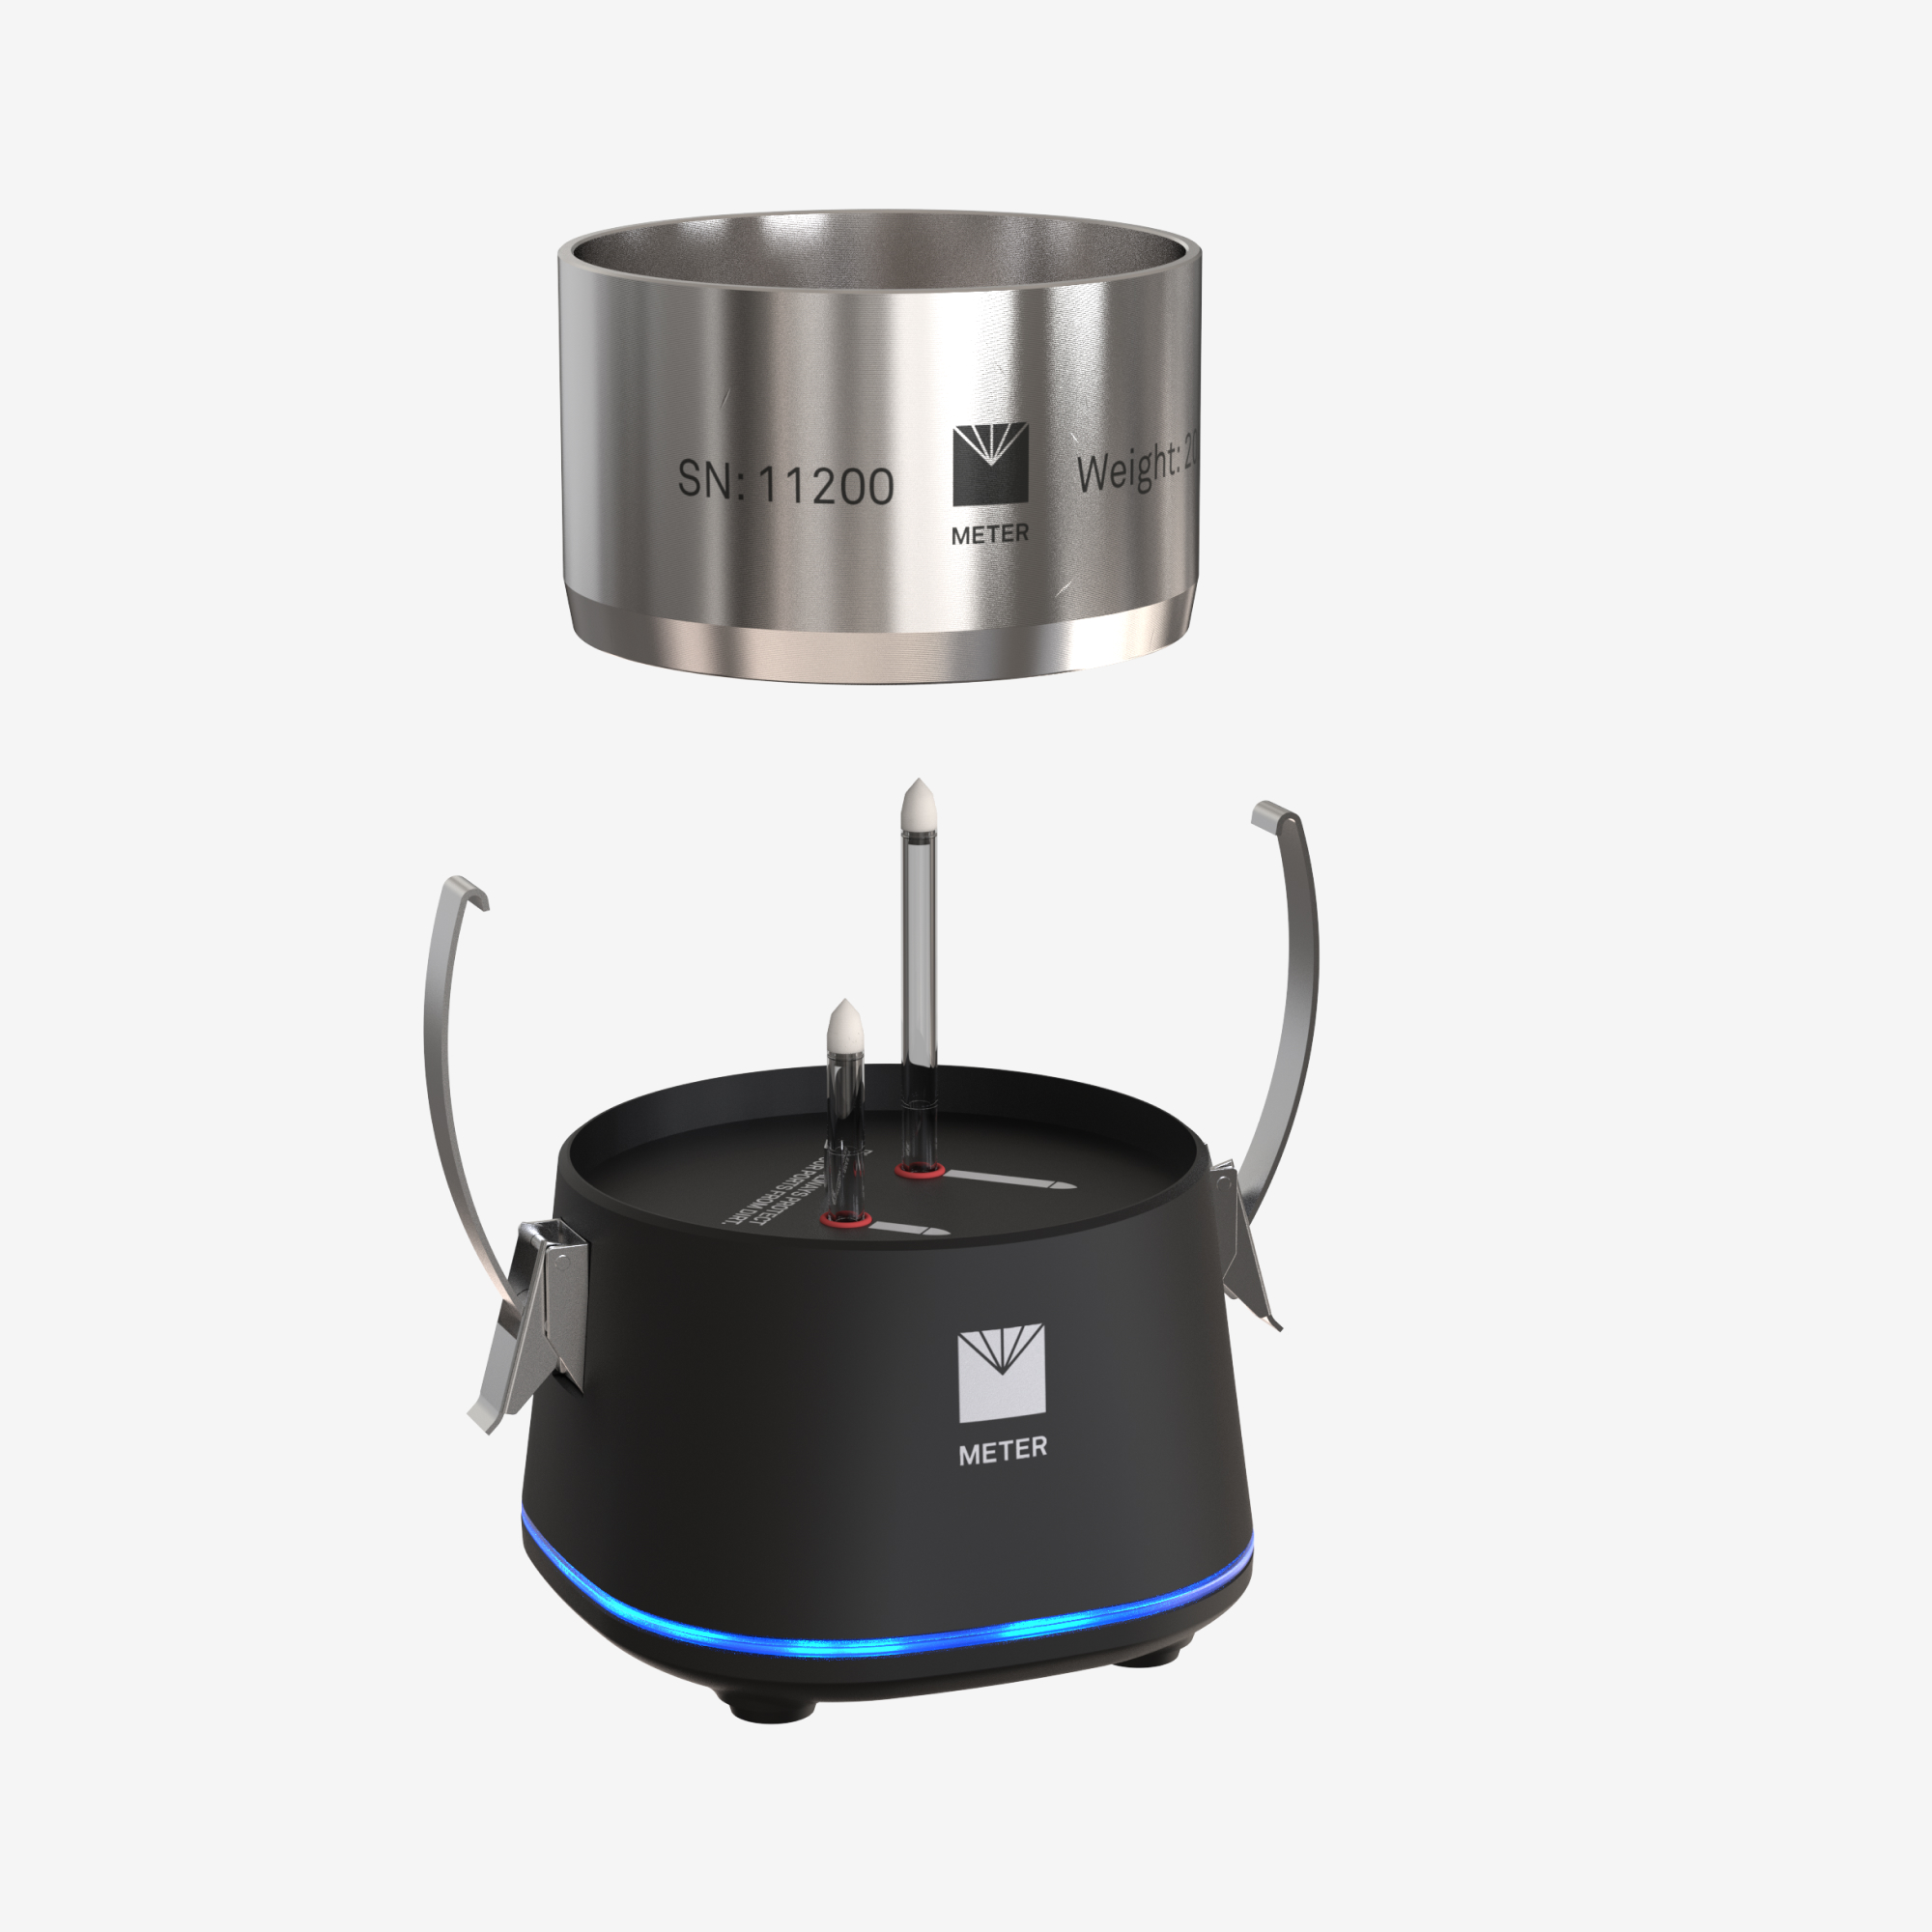
The HYPROP uses two precision mini-tensiometers to measure water potential at different levels within a saturated soil sample while the sample rests on a laboratory balance. Over time, the sample dries, and the instrument measures the changing water potential and the changing sample weight simultaneously. It calculates the moisture content from the weight measurements and plots changes in water potential correlated to changes in moisture content.
The faster, the better
After setup, the HYPROP is capable of generating a soil moisture characteristic curve and determining the unsaturated hydraulic conductivity of soil samples in only days versus months. To save you even more time, it can operate while being left unattended.
Automated everything
The HYPROP is a complex instrument, but it makes soil moisture release curves much simpler. While other methods require weeks of tedious drying and weighing, the HYPROP can be set up to run automatically. Its software calculates values for dry range and saturation according to a selected model, and it even allows you to input data from other water potential instruments such as the WP4C to automatically fit the soil moisture release curves.
The expert on soil moisture release curves (so you don’t have to be)
HYPROP generates the best data on the wet end of the soil water characteristic curve, with more details than any instrument on the market. Plus, you can combine the HYPROP with any LABROS instrument for a complete soil analysis—the PARIO for soil particle size analysis, the WP4C for a complete moisture release curve, or the KSAT for a hydraulic conductivity curve. The result? Powerful tools for understanding data and predicting a soil’s behavior over time.
Unparalleled accuracy. Automation. Far faster speeds. The HYPROP meets the highest lab instrumentation standards, giving you results you can trust with far less work and hassle.
-
Features
- More precise and robust
- Low time, cost, and effort
- Easy to handle and flexible
- Compliant with ASTM standard D6836-25
- Simultaneous measurement of water retention function and hydraulic conductivity
- High validity of the water retention function, especially in the area close to saturation
- The hydraulic functions are consistently verified by a large number of measuring values
- Reliable determination of unsaturated conductivity in the medium water potential range—independent of model assumptions
- Tensiometers measure beyond typical cavitation point down to –400 kPa
- Tensiometers are positioned upside down in the soil sample (undisturbed evaporation and no impact on the tensiometer shafts)
- Reduced tensiometer water loss after reaching the cavitation phase
- Use the HYPROP/VARIOS Connector to calculate soil moisture release curves and thermal dryout curves simultaneously.
-
Specifications
-
TECHNICAL SPECIFICATIONS
Measurement Specifications
Measuring RangePressure transducer: +0.3 kPa to –100 kPa (–400 kPa with boiling delay)
Temperature sensor: -20 to 60 °CAccuracyPressure measurement: 0.1 kPa (+0.3 kPa to –100 kPa using auto-zero calibration)Temperature measurement: 0.2 K (at -10 to 30 °C)ResolutionPressure transducer: 0.001 kPa
Temperature: 0.01 °CVolume of Soil250 cm3 / 100 cm3Measurement Interval (default)10 min
Number of Sensor UnitsMulti-balance mode: Max. 20 balances and sensor units / max. 10 per USB hub
Single-balance mode: Max. 20 per HYPROP USB adapterCommunication Specifications
Power RequirementsVoltage: 6-18 V DC
Current: 15 mA nominal, 200 mA max.Computer CompatibilityMicrosoft Windows 10 or newer
Physical Specifications
Sensor UnitMaterial: POM
Dimensions: Height 63 mm, Width 95 x 95 mmTensiometer ShaftCeramic: AI203 sinter; Ø 5 mm
Shaft material: Acrylic glass; Ø 5 mm
Total length: Short shaft: 24 mm; Long shaft: 49 mmPolyurethane TubingOuter diameter: 6 mm
Inner diameter: 4 mm
Length: 0.3 mProtectionHousing with covered plug: IP 65 splash waterproof
Chemical ResistancepH range: pH 3- pH 10
Operating Temperature Range10–30 °C
Required External MeasurementDry soil weight
Air-entry valve of tensiometer shaftsLABROS BalanceConnection to computer: USB
Weighing Range2200 g
Readout0.01 g
Reproducibility0.01 g
Linearity0.01 g
AdjustmentInternally
Other
GSA
-
Support / FAQ
-
HYPROP 3 ManualManualPDF, 5.392MBHYPROP 2 ManualManualPDF, 0.0122MBLABROS Soilview-Analysis HYPROP ManualManualPDF, 0.0047MBLABROS Soilview and Soilview-Analysis SoftwareSoftwareEXE, 121MBHYPROP/KSAT 2-inch adapter manualManualPDF, 1.1MBLABROS Balance - ManualManualPDF, 6MBVIDEO: How to collect a sample for HYPROP, VARIOS, & KSATInstructionsURL
-
HOW TO CREATE A FULL MOISTURE RELEASE CURVE USING THE WP4C AND HYPROPInstructionsPDFApp note: WP4C measurement with LABROSInstructionsPDF, 807 KBHYPROP/VARIOS Connector Application NoteInstructionsPDF, 3.2 MBHYPROP Tensiometer Shafts Application GuideInstructionsPDF, 1,655 KBVIDEO: HYPROP Vacuum System TroubleshootingInstructionsURLHYPROP app note: How to determine the air-entry pointInstructionsPDF
-
HYPROP 2 FAQs
- How can I create a full soil moisture release curve?
- See this article.
- How do I run the HYPROP?
- See the HYPROP How-To Videos.
- What do I need to check if data stops recording during a measurement?
- Check the cable connection to the USB port. Change the energy management of your computer to Continuous Operation (which is standard when using a laptop). If using a USB hub, make sure it is properly powered.
- What might be an explanation for this behavior of the pressure curves?
- It could be that the tensiometer shafts are not screwed in tightly enough.
- How do expansive soils impact the HYPROP measurement process?
-
In expansive soils, the water content/water potential relationship has to be interpreted as the amount of water per mass of soil. To convert it to a volumetric retention curve, you can either act on the assumption of a constant volume (which happens during the integrated HYPROP evaluation and is wrong, in this case) or convert it in volumetric water content by knowing the shrinking characteristic. There are three aspects to this conversion:
If the formation of gaps due to shrinkage is large, the retention curve should be interpreted in relation to gravimetric water content rather than volumetric water content The second aspect concerns the position of the tensiometer ceramics, as they could no longer be positioned symmetrically in the soil sample. This also causes an error, especially when calculating the conductivity values. The error from calculating the retention data is less serious. The third aspect is the problem of water vapor, which escapes laterally from the gaps. This also will cause an error (especially when calculating the conductivity) as this acts on the assumption that the total water loss from the lower half of the sample happens only in a vertical direction.
- Can two HYPROPs be degassed at the same time using the refill unit?
- Yes, more than one HYPROP can be degassed at the same time. Though the instruments are designed to use one vacuum pump with one vacuum mount and one beaker mount for one HYPROP and four tensiometer shafts, there is no problem to connect more devices by using another tube and beaker mount, as long as the system is tight. You can check this using a manometer.
- The scale is turned on and connected to the software, but it is marked grey and "not available." What can be the problem?
- The scale may be measuring with an unsupported unit. With HYPROP balances it can only be measured in grams, because measuring in other units is not supported by the HYPROP-VIEW Software. You can fix this issue by pressing the “function” button. Please be sure that the following settings are set right, especially the last one (number 7). This should say F. 1.
- Using single balance mode, the weighing screen pops up continuously even though the HYPROP is connected. Why?
- The software could be assuming that the HYPROP is not connected. Please check the connection of HYPROP to the tensioLINK adapter to ensure it is not loose or malfunctioning.
- Why does the scale not record the weight during the measurement?
-
There are three possible explanations for this issue:
- The scale is not switched on. Because of this, the scale will be detected by the software but cannot log any data. You will know that the scale is switched on when the weight appears on its display.
- The scale is being used in a wrong mode and therefore cannot log the weight.
- One balance for many HYPROPs: No automatic measurement of the weight is possible. The weight changes have to be taken manually (see manual).
- One balance per HYPROP: The weight changes will be recorded automatically. Weights cannot be taken manually.
- The default settings on the scales were changed. Check to ensure that the scale settings match the defined settings shown in the user manual (see section “Preparing a Measurement” under “Default Settings”).
- How can a typical HYPROP measuring curve of pure fine and middle sand (Ss) be described?
-
The following measuring curve is typical for sand with narrow particle size distribution and without fines:
- The tensions rise immediately and spontaneously after the start of the measurement until they reach a level that corresponds to the air entry point.
- The tensiometer shafts run completely parallel for a long time and differ only around a hydrostatic pressure difference of 2.5 hPa.
- After draining the main pore portion, the tensiometer shaft value of the upper tensiometer shaft rises extremely steep. The dropping out of the tensiometer shaft is now very quick.
- At the end of the measurement, the lower tensiometer shaft is still completely unaffected by the extreme dehydration front, and the difference of water tensions is very high.
- Hydraulic conductivities can be calculated only for a short period of time.
- The measurement is completed due to the dropout of the upper tensiometer shaft after a water loss of approximately 35 percent.
- How can a typical HYPROP measuring curve of slightly loamy sand (Sl2) be described?
-
The measuring curve of S12 can be described with the following parameters:
- The tensions rise immediately after the start of measurement until the level of the air entry point is reached.
- A soft jerking at the beginning of the measurement can be an indication that the air enters the system sporadically, rather than uniformly. This will be reflected in the evaluation of the retention curve. The tensiometers will be performing completely parallel for a long time, with only the 2.5 hPa hydrostatic pressure difference between each other.
- The upper tensiometer first rises exponentially only after the drainage of the main pore portion. The dropping out of the tensiometer follows very fast and the air entry point of the ceramic cup is reached shortly after that. The lower tensiometer is still in the regular measuring area.
- The difference of the tensions is big enough for the hydraulic conductivity to be calculated only after reaching the exponential rise.
- The measurement is finished with the dropping out of the upper tensiometer, after the withdrawal of nearly 30 percent of the water.
- How can a typical HYPROP measuring curve of clayey silt (Ut3) be described?
-
The following measuring curve is typical for very fine-grained substrates:
- The tensions rise immediately and spontaneously, steep and continuous after the start of the measurement. This reflects a very small coarse porosity. pF 2.0 is reached after a few hours (under evaporation conditions with fan). The water loss until the time pF 2.0 is reached is approximately 4 percent. The jerking, which occurs at the beginning of the measurement, shows the discontinuous entry of the air in the soil.
- After reaching approximately 100 hPa (pF 2.0), the difference between the tensiometers (which have been parallel until this point) is big enough to determine the hydraulic conductivity.
- Both tensiometers rise unabated as time progresses and drop out quite soon. The clayey silt has just a few big medium pores. The finer middle pores area is still filled with water at the time the tensiometer drops out and the water content is accordingly high.
- The dispersion of the tensiometer values is moderate over the whole measurement process, which indicates a relatively high, unsaturated conductivity.
- The measurement is finished when the upper tensiometer drops out after less than one day. At this point, the water loss of the sample is approximately 20 percent.
- How can a typical HYPROP measuring curve of sandy clay (Ls3) be described?
-
The following measurement curve is typical for clay with a wide pore size distribution:
- The tensions rise continuously with a moderate increase for about two days. This reflects a coarse pore portion of about 10 percent.
- Both tensiometer values proceed parallel until about 50 hPa (pF 1.7). From this point on, the tensiometer values are apart enough that the hydraulic conductivity can be determined.
- After about two days, the tensiometer values rise with greater increase but still weak bending. The measurement limit is reached just one day later. This indicates a limited and simultaneously diversified middle pore portion.
- The dispersion of the tensiometer values is moderate, which indicates a relatively high hydraulic conductivity in this area. In this case, the measurement is finished when the upper tensiometer drops out (after about three days). At this point, the water loss of the sample is approximately 17 percent.
- What if my HYPROP shows a constant value of 4000 hPa (400 kPa)?
- If your HYPROP shows a constant value of 4000 hPa (400 kPa), the pressure sensor is damaged. Please contact METER Group support or your local dealer to send the device in for checking and repair. We will repair it fast and with cost-efficiency.
-
Resources / Publications
-
Educational links
- The researcher’s complete guide to water potential
- Nature Geoscience peer reviewed article: Confronting the water potential information gap
- Lab vs. field instruments: Why you should use both
- Soil moisture release curves: Why you need them. How to use them.
- 5 reasons you’re getting less accurate soil moisture release curves
- Webinar: Water potential 101
- Webinar: Soil moisture 302: Hydraulic conductivity—Which instrument is right for you?
- Soil moisture master class
- Webinar: Soil moisture: Why water content can’t tell you everything you need to know
Support links
- HYPROP How-To Videos
- Manuals and software
- How to create a full moisture release curve using HYPROP and WP4C
- HYPROP app note: How to determine the air-entry point
- App note: WP4C measurement using LABROS SOILVIEW software
- HYPROP/VARIOS Connector app note: How to measure soil water tension, water content, and thermal conductivity in one soil sample
Case studies
-
Selected Publications
Listed below are a few examples of cited publications for the HYPROP 2 This list is not exhaustive.
2020
- Domínguez-Niño, Jesús María, Gerard Arbat, Iael Raij-Hoffman, Isaya Kisekka, Joan Girona, and Jaume Casadesús. “Parameterization of Soil Hydraulic Parameters for HYDRUS-3D Simulation of Soil Water Dynamics in a Drip-Irrigated Orchard.” Water 12, no. 7 (2020): 1858. (Article link).
- Fields, Jeb S., James S. Owen Jr, Ryan D. Stewart, Josh L. Heitman, and Jean Caron. “Modeling water fluxes through containerized soilless substrates using HYDRUS.” Vadose Zone Journal 19, no. 1 (2020): e20031. (Article link).
- Fontanet, Mireia, Elia Scudiero, Todd H. Skaggs, Daniel Fernàndez-Garcia, Francesc Ferrer, Gema Rodrigo, and Joaquim Bellvert. “Dynamic Management Zones for Irrigation Scheduling.” Agricultural Water Management 238 (2020): 106207. (Article link).
- Jackisch, Conrad, Kai Germer, Thomas Graeff, Ines Andrä, Katrin Schulz, Marcus Schiedung, Jaqueline Haller-Jans et al. “Soil moisture and matric potential–an open field comparison of sensor systems.” Earth System Science Data 12, no. 1 (2020). (Article link).
- Shokrana, Md Sami Bin, and Ehsan Ghane. “Measurement of soil water characteristic curve using HYPROP2.” MethodsX (2020): 100840. (Article link).
2019
- Fidantemiz, Yavuz F., Xinhua Jia, Aaron LM Daigh, Harlene Hatterman-Valenti, Dean D. Steele, Ali R. Niaghi, and Halis Simsek. “Effect of water table depth on soybean water use, growth, and yield parameters.” Water 11, no. 5 (2019): 931. (Article link).
- Händel, Falk, Thomas Fichtner, and Peter-Wolfgang Graeber. “Numerical and Laboratory Investigations of Closely-Spaced and Joint Infiltration of Precipitation and Treated Waste Water.” Water 11, no. 11 (2019): 2262. (Article link).
-
Accessories


Request a quote
Fill out the form below to help us pair you with the right expert. We’ll prepare the information you request, then contact you as soon as possible.